


Market Update
- Rezny Wealth
- May 21, 2017
- 2 min read
“You work hard for your money. We’ll work hard to protect it.”
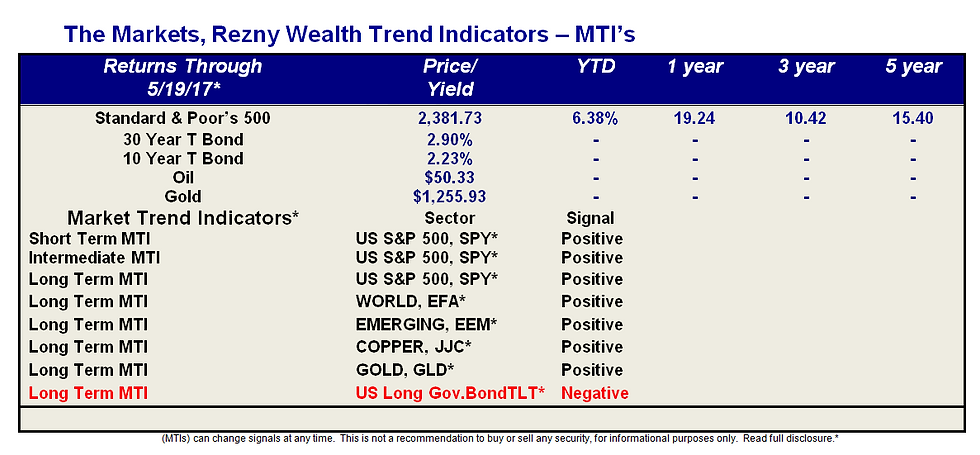
Market Direction Is Important –
Updated Chart of the S&P 500 and Secondary Signals

Of our Four secondary indicators under our MTI:
Relative Strength Index (RSI)-Positive
Chaikin Money Flow (CMF)-Positive
MACD- Negative
Money Flow Index-MFI-Positive
More on the Market and the Economy:
Stocks finished higher on Friday, though not enough to bounce back from losses earlier in the week, leaving the S&P 500 with a .4% weekly loss.

Source: dshort.com
This week data will be released on new home sales, existing home sales, GDP and the Fed’s FOMC meeting minutes.
The Conference Boards leading economic index increased .3% to 126.9 in April. According to the Conference Board, “the recent trend in the U.S. LEI, led by the positive outlook of consumers and financial markets, continues to point to a growing economy, perhaps even a cyclical pickup. First quarter’s weak GDP growth is likely a temporary hiccup as the economy returns to its long-term trend of about 2 percent. While the majority of leading indicators have been contributing positively in recent months, housing permits followed by average workweek in manufacturing have been the sources of weakness among the U.S. LEI components”.

The Atlanta Fed’s GDPNow forecast for second quarter growth rose to 4.1% following the release of data on housing starts and industrial production.

Builder confidence rose in May, as the NAHB index rose two points to 70. According to the NAHB, “this report shows that builders’ optimism in the housing market is solidifying, even as they deal with higher building material costs and shortages of lots and labor”. Measures of current sales conditions and sales expectations increased, while a measure of buyer traffic slipped: “the HMI measure of future sales conditions reached its highest level since June 2005, a sign of growing consumer confidence in the new home market. Especially as existing home inventory remains tight, we can expect increased demand for new construction moving forward”.
Housing starts slowed in April, down 2.6% to an annual pace of 1.17 million, while permits fell 2.5% to a pace of 1.23 million.


Comments